BE/Bi 103, Fall 2018: Homework 5
Due 1pm or 7pm, Sunday, November 4
(c) 2018 Justin Bois. With the exception of pasted graphics, where the source is noted, this work is licensed under a Creative Commons Attribution License CC-BY 4.0. All code contained herein is licensed under an MIT license.
This document was prepared at Caltech with financial support from the Donna and Benjamin M. Rosen Bioengineering Center.

This homework was generated from an Jupyter notebook. You can download the notebook here.
Problem 5.1: Hacker stats and Darwin's finches (100 pts)
Peter and Rosemary Grant of Princeton University have visited the island of Daphne Major on the Galápagos every year for over forty years and have been taking a careful inventory of the finches there. The Grants recently published a wonderful book, 40 years of evolution: Darwin's finches on Daphne Major Island. They were generous and made their data publicly available on the Dryad data repository. (In general, it is a very good idea to put your published data in public data repositories, both to preserve the data and also to make your findings public.) We will be using this data set to learn about evolution of Darwin's finches and use your hacker statistics skills. Up until part (f), all of your analyses will use nonparametric frequentist hacker stats.
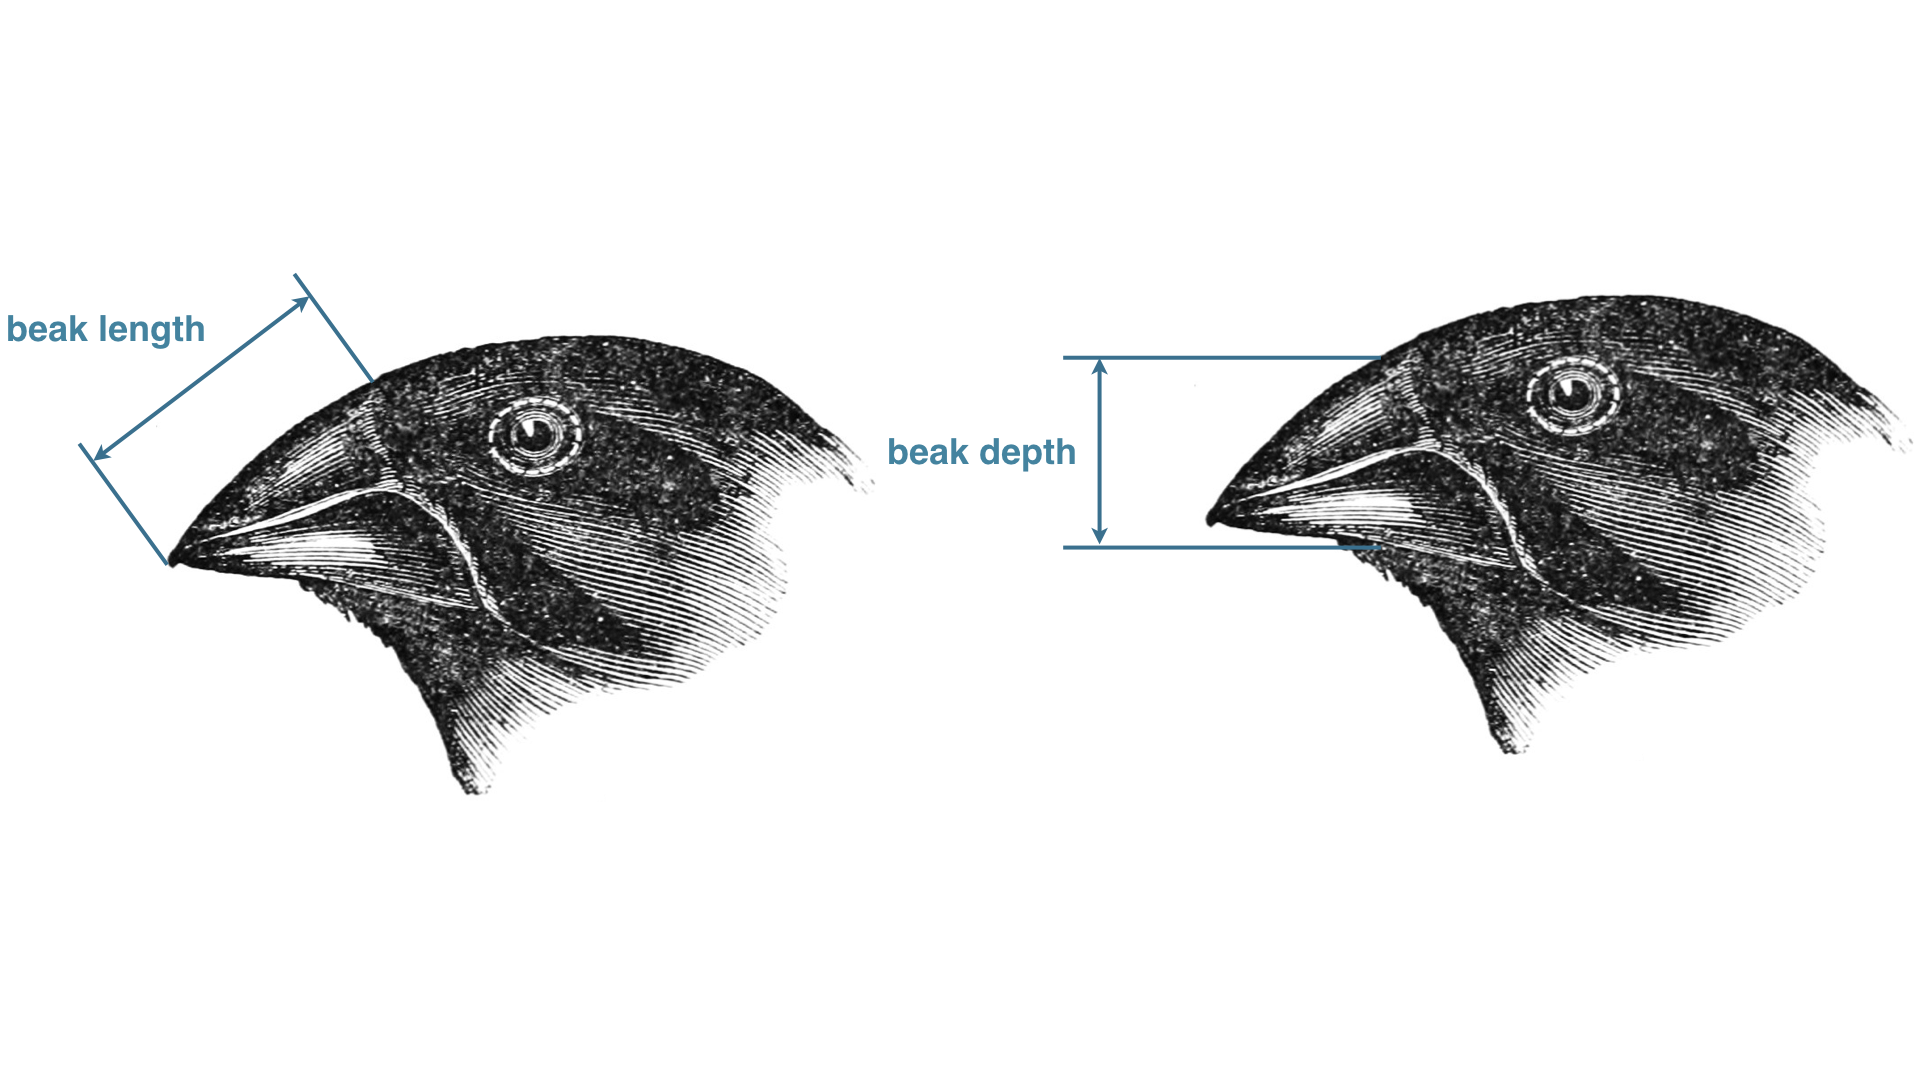
We will focus on the primary two species of ground finch on Daphne Major, Geospiza fortis and Geospiza scandens. In this data set, you will find measurements of the beak length (tip to base) and beak depth (top to bottom) of these finches in the years 1973, 1975, 1987, 1991, and 2012. Also included in that data set is the band number for the bird, which gives a unique identifier. The image below defines the beak length and beak depth.

a) We start with a little tidying of the data. Think about how you will deal with duplicate measurements of the same bird and make a decision on how those data are to be treated.
b) Plot ECDFs of the beak depths of Geospiza scandens in 1975 and in 2012. Then, estimate the mean beak depth in for each of these years with confidence intervals.
c) Perform a hypothesis test comparing the G. scandens beak depths in 1975 and 2012. Carefully state your null hypothesis, your test statistic, and your definition of what it means to be at least as extreme as the observed test statistic. Comment on the results. It might be interesting to know that a severe drought in 1976 and 1977 resulted in the death of the plants that produce small seeds on the island.
d) Devise a measure for the shape of a beak. That is, invent some scalar measure that combines both the length and depth of the beak. Compare this measure between species and through time. (This is very open-ended. It is up to you to define the measure, make relevant plots, compute confidence intervals, and possibly do hypothesis tests to see how shape changes over time and between the two species.)
e) Introgressive hybridization occurs when a G. scandens bird mates with a G. fortis bird, and then the offspring mates again with pure G. scandens. This brings traits from G. fortis into the G. scandens genome. As this may be a mode by which beak geometries of G. scandens change over time, it is useful to know how heritable a trait is. Heritability is defined as the ratio of the covariance between parents and offsprings to the variance of the parents alone. To be clear, the heritability is defined as follows.
- Compute the average value of a trait in a pair of parents.
- Compute the average value of that trait among the offspring of those parents.
- Do this for each set of parents/offspring. Using this data set, compute the covariance between the average offspring and average parents and the variance among all average parents.
- The heritability , $h^2$, is the ratio of the covariance between parents and offspring to the variance of the parents, $h^2 = \sigma_{po}/\sigma_p^2$.
This is a more apt definition than, say, the Pearson correlation, because it is a direct comparison between parents and offspring.
Heritability data for beak depth for G. fortis and G. scandens can be found here and here, respectively. (Be sure to look at the files before reading them in; they do have different formats.) From these data, compute the heritability of beak depth in the two species, with confidence intervals. How do they differ, and what consequences might this have for introgressive hybridization?