Homework 3.2: Peter and Rosemary Grant and Darwin’s finches (55 pts)
Peter and Rosemary Grant of Princeton University have visited the island of Daphne Major on the Galápagos every year for over forty years and have been taking a careful inventory of the finches there. The Grants recently published a wonderful book, 40 years of evolution: Darwin’s finches on Daphne Major Island. They were generous and made their data publicly available on the Dryad data repository.
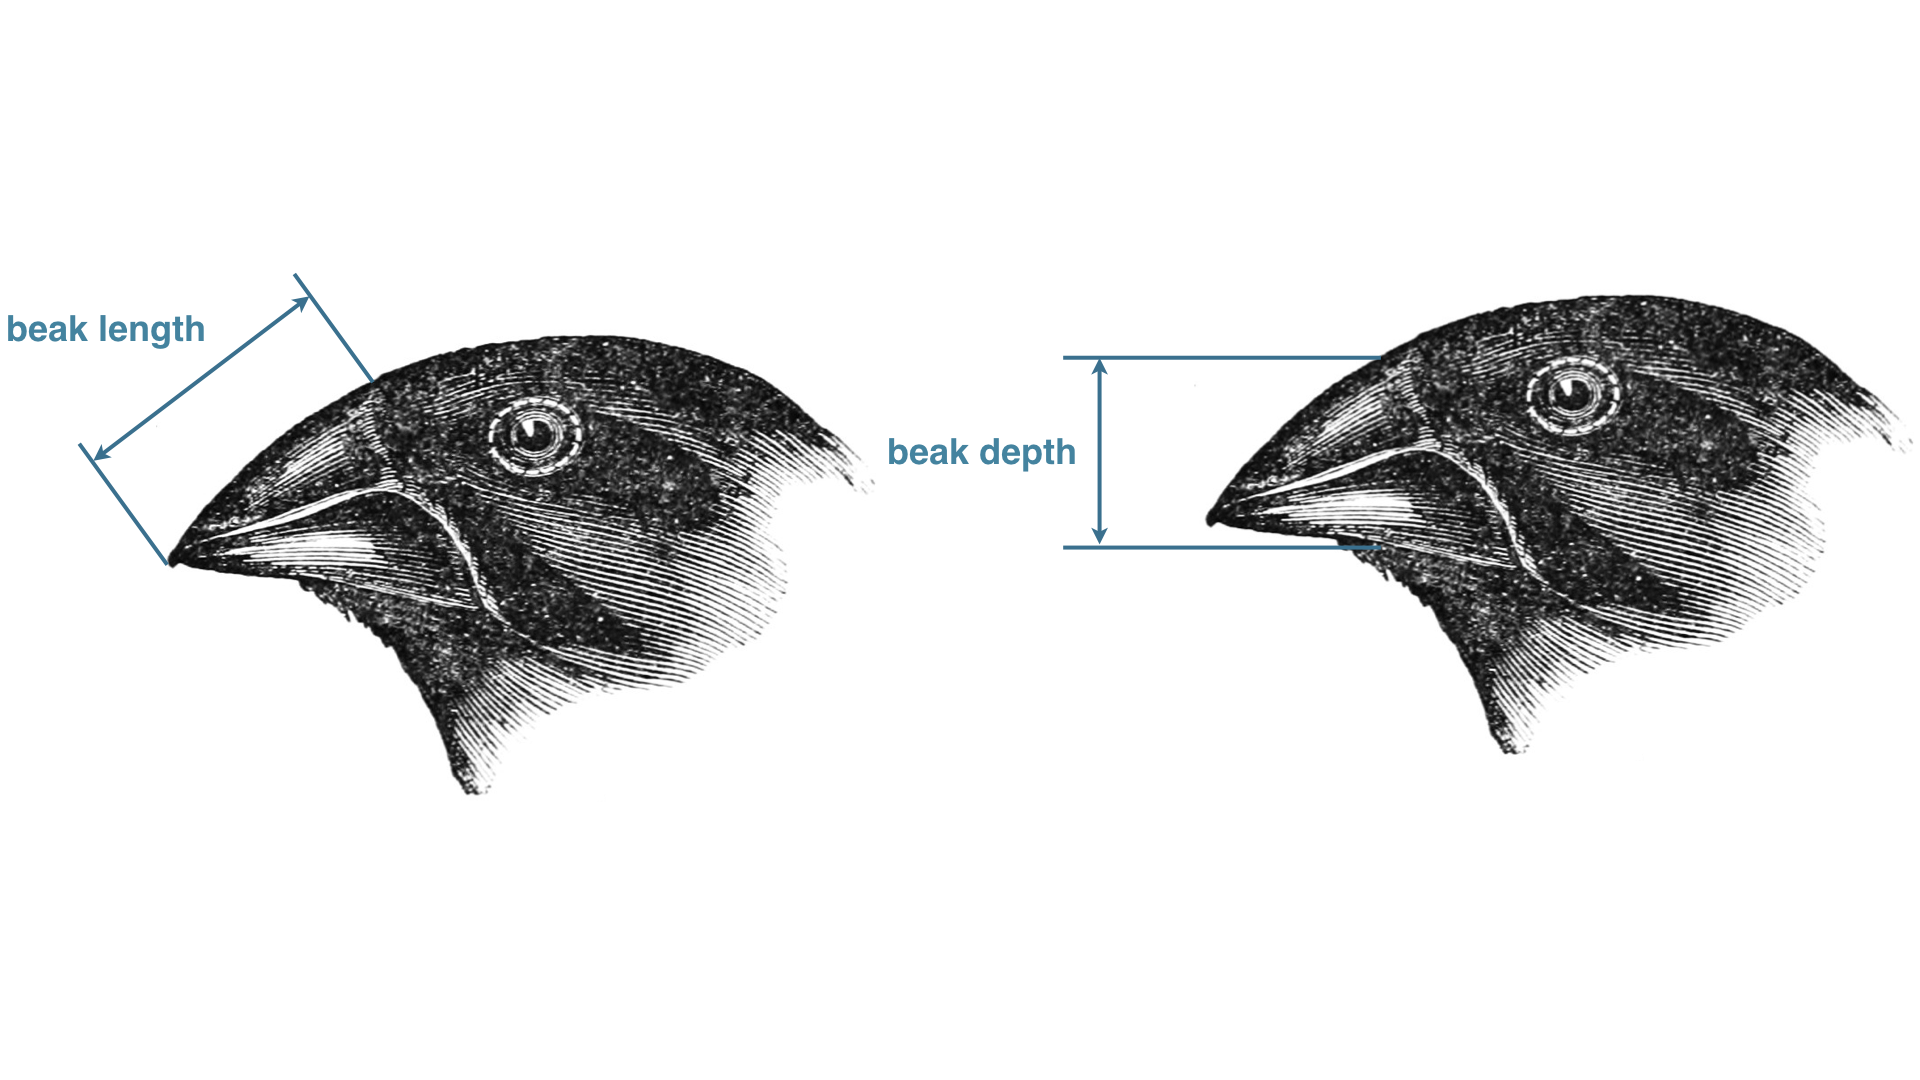
We will focus on the primary two species of ground finch on Daphne Major, Geospiza fortis and Geospiza scandens. In this data set, you will find measurements of the beak length (tip to base) and beak depth (top to bottom) of these finches in the years 1973, 1975, 1987, 1991, and 2012. Also included in that data set is the band number for the bird, which gives a unique identifier. (I obtained the data sets as separate files from the Dryad repository, tidied them, and saved the data set as a CSV.) The image below defines the beak length and beak depth.
This problem is very open ended. Your task is simply this: perform exploratory data analysis on this data set.
Giving open-ended problems like this tends to leave some students concerned or confused about how they will be evaluated on it. I find that it is worth the potential confusion to give students maximum flexibility for thinking and discussion, and also to simulate “real life.” To give you an idea of our expectations for this, you should try (and display) several types of plots to explore the results. Consider how, e.g., beak depth changes over time, how it varies with beak length, how that variation changes of time, etc. You should comment on your approach and what you learn from the plots. At the least, you should explore the data with instructive plots and see if you can find evidence of evolution.
Most importantly, this data set is beautiful. You should have fun exploring!