Homework 4.2: Screening enzyme activity with a colorimetric assay (60 pts)
Dataset 1 download, Dataset 2 download
This problem was primarily written by Patrick Almhjell, who also acquired the data set.
Directed evolution
Directed evolution is an iterative approach to protein engineering that relies on the ability to develop a method for quantifying and comparing protein activity. This means that your starting protein (the “parent”) must have some starting activity, and it must be detectable and reproducible during screening. The process looks this this:
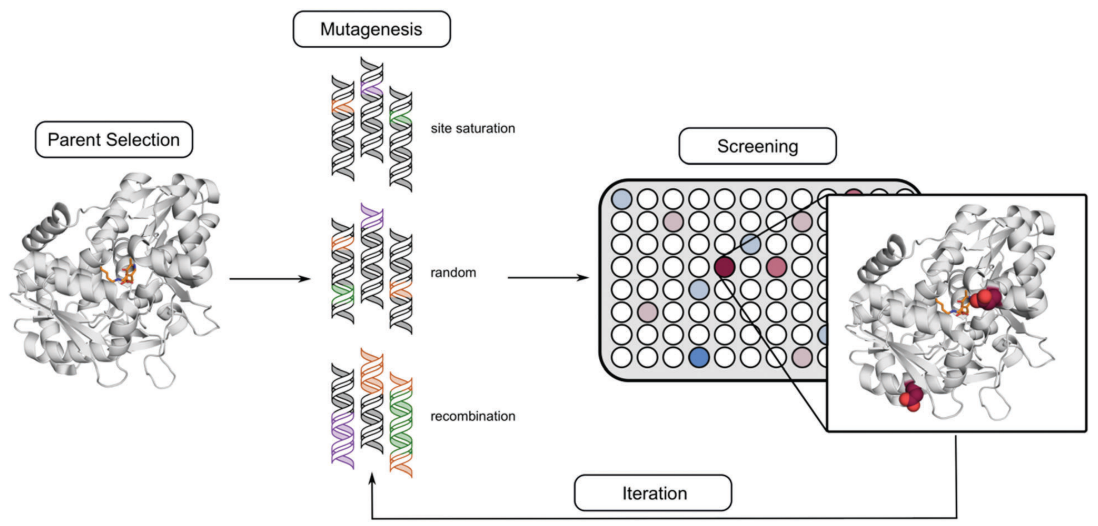
Ideally the screening method is high throughput, allowing the user to analyze on the order of 1000 protein variants per day (or more). When there is a detectable absorbance or fluorescence change due to protein activity over time, this allows for the use of a plate reader (such as the Tecan Infinite 200) to collect data from a 96-well plate in ≈1 minute. If the absorbance or fluorescence value can be assumed to be proportional to enzyme activity, then one can screen the activity of ≈100 enzyme variants per minute (with some down-time when exchanging plates).
Processing pipelines from the plate reader
Unfortunately, the Tecan returns human-readable MS Excel files, which stymie automated processing. As such, data wrangling and visualization pipelines are necessary to streamline the analysis and make use of the instrument more efficiently. Developing code to do these processing pipelines are beneficial you and anyone else in the lab who uses the instrument. (This is true for all shared lab instrumentation.)
Your plate reader data set
The data you will be working with comes from screening variants of the beta-subunit Tryptophan Synthase (TrpB) for activity on a non-natural substrate. TrpB plays an important role in biological systems, catalyzing the final step of tryptophan synthesis for the cell. It does so by combining indole—the sidechain of tryptophan—and the natural amino acid serine in a single step, releasing water as the only byproduct and forming a new carbon–carbon bond. Indole is strongly absorbing in the near-UV region, but undergoes a very slight red-shift in absorbance when it is converted to tryptophan:
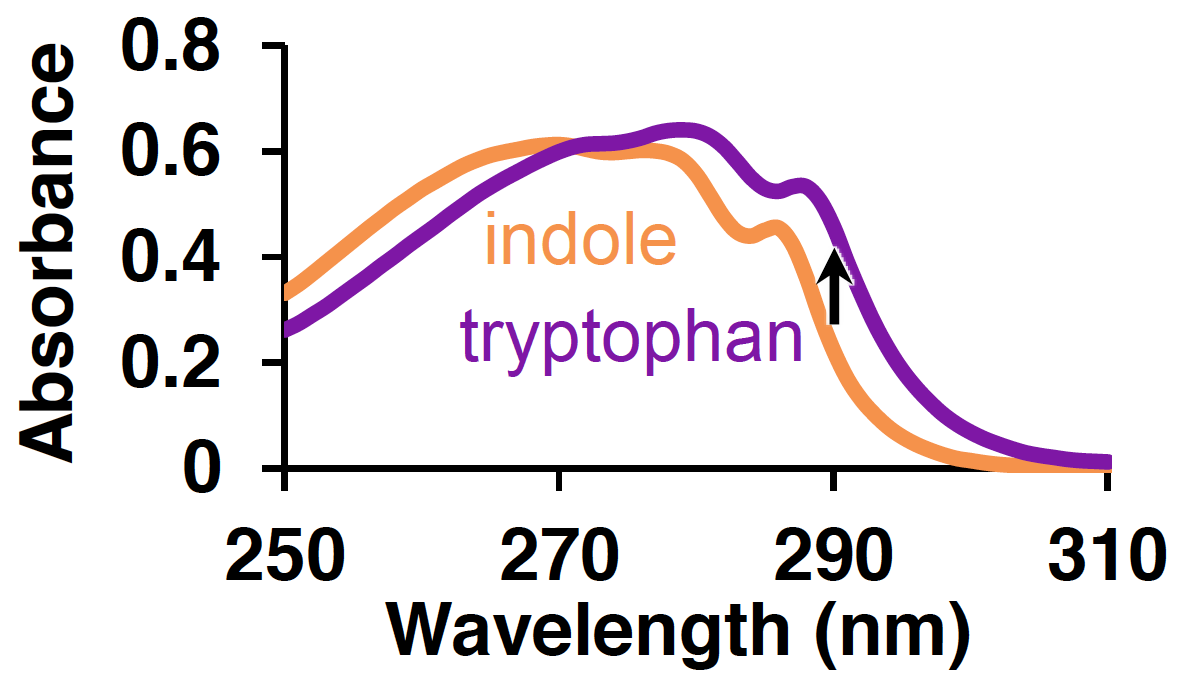
This red-shift occurs for the conversion of all indole analogues to the corresponding tryptophan analogue, allowing the same type of colorimetric screening method to be used to evolve non-natural activity; we just look for an increase in absorbance over time.
Your tasks
We will be looking at some screening development data for the indole analogue 4-bromoindole, using the wavelength 300 nm. In this step, we fill a 96-well plate with 92 copies of our parent TrpB enzyme, along with four controls. Your goal is to ensure that this colormetric screen works, and we see an increase in absorbance from start to end that is similar across all parents.
Control wells are specified as follows:
controls = {
    'Sterile' : ['E12'],
    'Negative' : ['F12', 'G12', 'H12'],
}
a) Create a function that can wrangle and tidy the Tecan data. Your final function should return a tidy DataFrame with the plate-reader data, metadata, and the provided control information. Important metadata might include the date, the mode of data collection, wavelength, the bandwidth, the number of flashes, etc.
b) Once you are able to get the data in tidy format, explore ways of visualizing it. A format similar to what is shown above (a 96-well plate) is an obvious choice, but you may choose to make additional plots.